At large current levels, there is a
considerable discrepancy between predicted values and experimental results.
This discrepancy is believed to be caused by the strong temperature
dependence of silicon properties such as the thermal conductivity and the
coefficient of thermal expansion. In the next section, a numerical solution
of the heat equation is introduced that incorporates temperature-dependent
properties of silicon.
In this study, the resistivity of silicon is
assumed to be independent of temperature. However, at high temperatures, the
resistivity also shows a strong temperature dependence, as shown in Figure
25. The change in the deflection curve at high current values is caused by
this behavior. At the intrinsic temperature point, intrinsic and dopant
charge carriers are equal and the resistivity is at a maximum [46]. The
intrinsic temperature of the SCS used in this research is estimated to be
800 K. Silicon that has been doped to a different level of electrical
resistivity will have a different intrinsic point.
Figure
25. Silicon resistivity versus current (left axis) and V-beam deflection
versus current (right axis).
When the intrinsic temperature is exceeded in
the beam, the silicon demonstrates a negative temperature coefficient of
resistivity. This effect occurs first at the middle of the beam, where the
temperature is highest. During testing, the actuators began to glow as
current was increased beyond the intrinsic point. When current was increased
further, the actuators melted. Therefore, the intrinsic temperature is
recommended as the maximum operational temperature of the V-beam actuators;
the corresponding current should be regarded as the maximum operational
current.
To measure force, some V-beam actuators are
connected to folded flexures, as shown in Figure 26. An array of ten
actuators is used to scale up total force for easier measurement. For any
given power, these actuators deflect less than free actuators because of the
stiffness of the folded flexures. Because of the linear relationship between
deflection and force, the following relationship can be written:
(39) 
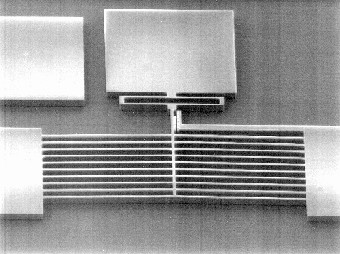
Figure
26.
Micrograph of folded flexures used to measure V-beam actuator force. Show
video (529 KB .mpeg file).
In this equation, ut is the
deflection of free actuators, uk is the deflection of the
actuators connected to folded flexures, Fk is the opposing
force from the folded flexures, Ft is the force exerted by
a single actuator at zero deflection, and k is the flexure spring
constant. This equation can be rearranged to give
(40) 
The flexure spring constant is calculated from
the geometry of the flexures and is approximately 200 N/m for the
configuration used in this study. In Figure 27, actuator force versus
applied current for two actuator configurations is shown. Again, widths are
given as fabricated, and solid lines represent predicted results. There is
good agreement between the measured values and predicted values, which are
calculated by using the thermomechanical analysis described above. In
practice, uk and ut are measured by
recording uk versus current while the folded flexures are
attached, then breaking the flexures off with a probe tip to allow
measurement of ut versus current. Errors due to variations
during fabrication are eliminated by using the same thermal actuators for
both measurements.
Figure
27. Force measurements versus current for two V-beam actuators. Solid lines
represent predicted results.
Transient experiments were performed on the
V-beam actuators with a laser Doppler vibrometer. These tests were performed
by mounting a chip vertically and focusing the laser on the side of an
actuator beam. The normalized frequency response of a V-beam actuator with a
length of 1000 mm and a fabricated width w'
of 8.4 mm is shown in Figure 28. As expected, the
full range of motion is maintained at low frequencies. As the frequency
increases past 100 Hz, response drops 20 dB per decade because the actuator
cannot complete each heating/cooling cycle fast enough to keep up with the
signal. By fitting a curve to the frequency response, the time constant of
this actuator is estimated at 1.6 ms, as shown as the solid line in Figure
28.
Figure
28. Normalized amplitude versus frequency for V-beam actuator. Solid line
represents fitted time constant.
The first-mode time constant t1
can be predicted by using Equation (36) and the material properties listed in Table
3 and Table 4 [37]. Because the properties of silicon
vary with temperature, values are calculated at 298 K and 800 K, the
recommended operating temperature range of the actuators. The time constants
are predicted to be 0.8 ms and 2.0 ms, respectively. These values fall on
either side of the measured time constant. It should be noted that the
voltage during transient testing was not high enough for the actuator to
reach 800 K; however, this temperature is used because it represents the
maximum actuator temperature at the maximum operational current.
Table
4. Selected parameters for transient analysis.
|
Temperature
|
Thermal
conductivity (ks) |
Specific heat (c)
|
Predicted
first-mode
time constant (t1) |
|
298
K (room temp.) |
148
W/m-K |
700
J/kg-K |
0.8
ms |
|
800
K (intrinsic point) |
42
W/m-K |
885
J/kg-K |
2.0
ms |
Measurements were also performed to determine
whether actuator performance is affected by repeated use. A 1200 mm
long actuator was operated for over 60 million cycles with a 10 V square
wave input at 50 Hz. The deflection was observed to be 14 mm with a variation of less than 1 mm
during the course of testing. During this research, no V-beam actuator was
observed to fail while being driven at less than the maximum operational
current.