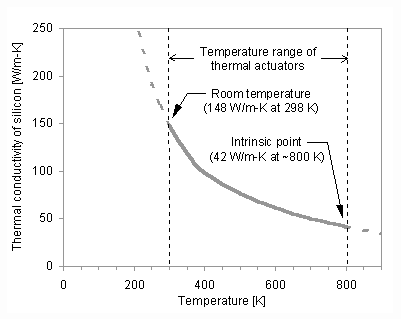
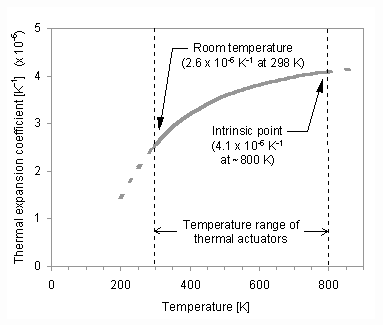
The exact electrothermal solution discussed above assumes constant material properties for silicon. However, the thermal conductivity ks and the thermal expansion coefficient a each show a significant dependence on temperature, as shown in Figure 29 and Figure 30. Again, the maximum operational temperature is taken to be 800 K. In Figure 29, ks has been approximated by [47]
and in Figure 30, a has been approximated by [48]
Figure 29. Variation in thermal conductivity of silicon with temperature.
Figure 30. Variation in thermal expansion coefficient of silicon with temperature.
Consequently, the heat and thermal expansion equations become nonlinear. However, a solution can be approximated by dividing the beam into elements and numerically calculating the temperature distribution. A program has been written in MATLAB(tm) that uses iteration to solve the equations to a specified degree of convergence. The operation of this program is described in Appendix C.
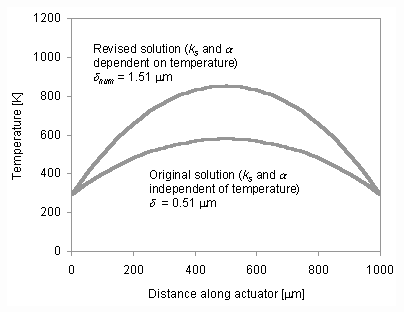
The original and revised solutions for a 1000 mm long, 10 mm wide beam at an applied current of 30 mA are compared in Figure 31. The decrease in thermal conductivity at high temperatures reduces the amount of heat conducted through the beam to the anchors; consequently, higher temperatures in the beam tend to increase deflection. Additionally, the increase in the thermal expansion coefficient at high temperatures also tends to increase deflection. For these reasons, the revised solution predicts a significantly larger thermal expansion than the original solution. In this case, deflection and force are increased by a factor of three solely due to temperature-dependent material properties.
Figure 31. Comparison of original and revised electrothermal solutions.
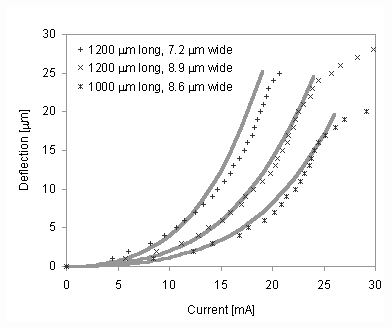
Figure 32 compares revised predictions from the numerical solution to experimental results, which are redrawn from Figure 24. Agreement is much better as a result of incorporating temperature-dependent properties of silicon, up to the intrinsic point.


